Iris Classification
[1]:
import matplotlib.pyplot as plt
from sklearn import datasets
from sklearn.cluster import AgglomerativeClustering
from sklearn.metrics import adjusted_rand_score

from rerf.urerf import UnsupervisedRandomForest
[2]:
# Load dataset
iris = datasets.load_iris()
[3]:
X = iris.data
[10]:
clf = UnsupervisedRandomForest(projection_matrix="RerF", random_state=0)
print(clf)
UnsupervisedRandomForest(feature_combinations='auto', max_depth=None,
                         max_features='auto', min_samples_split='auto',
                         n_estimators=100, n_jobs=None,
                         projection_matrix='RerF', random_state=0)
[11]:
clf.fit(X)
sim_mat = clf.transform()
print(sim_mat)
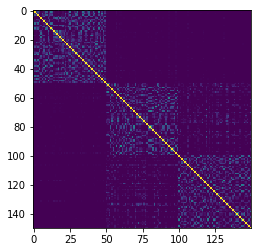
plt.imshow(sim_mat)
[[1.   0.05 0.05 ... 0.   0.   0.  ]
 [0.06 1.   0.13 ... 0.   0.   0.  ]
 [0.02 0.17 1.   ... 0.   0.   0.  ]
 ...
 [0.   0.   0.   ... 1.   0.05 0.06]
 [0.   0.   0.   ... 0.07 1.   0.03]
 [0.   0.   0.   ... 0.09 0.   1.  ]]
[11]:
<matplotlib.image.AxesImage at 0x7fce9ad1be50>

[12]:
cluster = AgglomerativeClustering(n_clusters=3, affinity="euclidean", linkage="ward")
predict_labels = cluster.fit_predict(sim_mat)
score = adjusted_rand_score(iris.target, predict_labels)

print("labels\n", iris.target)
print("predict\n", predict_labels)
print("Adjusted Rand Score:", score)
labels
 [0 0 0 0 0 0 0 0 0 0 0 0 0 0 0 0 0 0 0 0 0 0 0 0 0 0 0 0 0 0 0 0 0 0 0 0 0
 0 0 0 0 0 0 0 0 0 0 0 0 0 1 1 1 1 1 1 1 1 1 1 1 1 1 1 1 1 1 1 1 1 1 1 1 1
 1 1 1 1 1 1 1 1 1 1 1 1 1 1 1 1 1 1 1 1 1 1 1 1 1 1 2 2 2 2 2 2 2 2 2 2 2
 2 2 2 2 2 2 2 2 2 2 2 2 2 2 2 2 2 2 2 2 2 2 2 2 2 2 2 2 2 2 2 2 2 2 2 2 2
 2 2]
predict
 [0 0 0 0 0 0 0 0 0 0 0 0 0 0 0 0 0 0 0 0 0 0 0 0 0 0 0 0 0 0 0 0 0 0 0 0 0
 0 0 0 0 0 0 0 0 0 0 0 0 0 1 1 1 2 1 2 1 2 1 2 2 2 2 1 2 1 2 2 1 2 1 1 1 1
 1 1 1 1 1 2 2 2 2 1 2 1 1 1 2 2 2 1 2 2 2 2 2 1 2 2 1 1 1 1 1 1 1 1 1 1 1
 1 1 1 1 1 1 1 1 1 1 1 1 1 1 1 1 1 1 1 1 1 1 1 1 1 1 1 1 1 1 1 1 1 1 1 1 1
 1 1]
Adjusted Rand Score: 0.644447235392006